Archive for the ‘maps’ Category

Map reprojection

Monday, July 26th, 2010

Ever wondered what a standard equirectangular projection map of the world would look like if the poles were in different places? Wonder no more! Just click and drag on the map below to move a piece of the world to somewhere else on the map - the rest will follow.

Flash is the best way to do this sort of thing in terms of market penetration, but Actionscript is surprisingly difficult to get started with. Adobe's tools are great, I'm sure, if you want to make animated vector movies but in trying to learn how to use them to do programmatically generated stuff like this I just got lost. Perhaps I just haven't discovered the right bit of documentation. I eventually found this to be a way in to the maze.

I hope to write some more fun little web toys like this in the coming weeks.

Edit: source code.
Map showing river basins

Tuesday, June 24th, 2008

I'd be interested to see a map of the UK where each point was coloured according to where the water that falls on the land corresponding to that point reaches the ocean.

Here's an example of the kind of thing I'm thinking of, except that this isn't very detailed - while it looks right for the Thames basin, lots of smaller rivers get bunched together (for example in the South-West).

This is a bit more like it but for Africa. Note that there are some regions which do not appear to be adjacent to any coast - this means that all the water from these areas ends up in interior lakes and ultimately evaporates again. They are Endorheic basins.

Holes in Finland

Saturday, April 1st, 2006

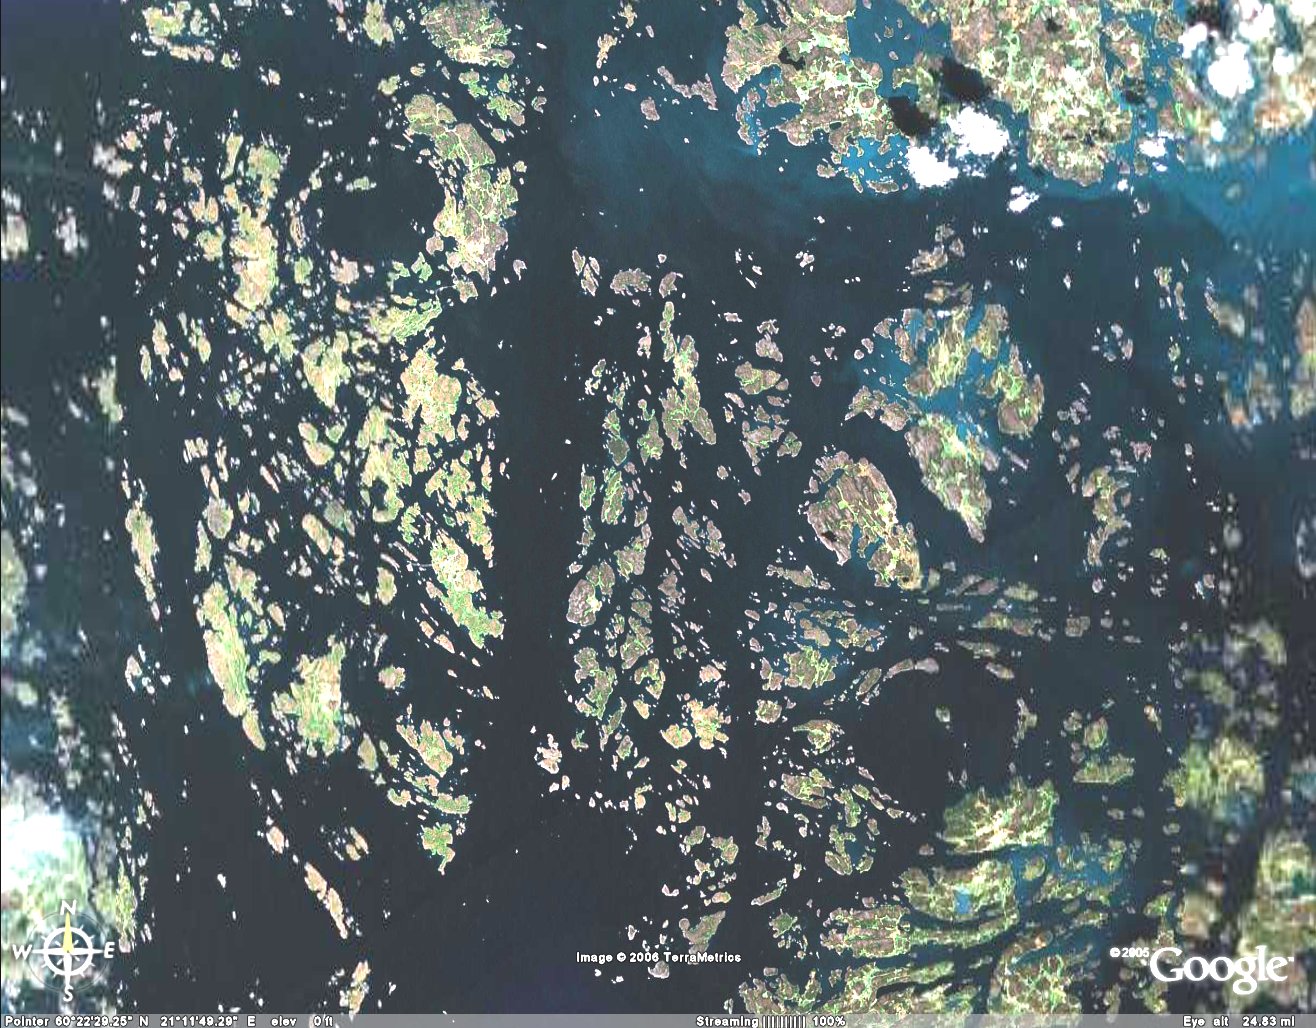
I was playing about with Google Earth and looking at some imagery of Finland (as you do) and I noticed these weird circular shaped "holes" (for want of a better word) in the distribution of the Ă…land islands. For scale, they are each about 3km in diameter and about 16km apart.

It's really strange the way it looks like there's a huge lens over each of these points, distorting the surrounding islands into sort-of circular shapes.

I'm quite mystified about what could have caused these. I can't imagine what sort of volcanic activity could have had that effect (volcanos tend to create mountains, not lakes) so I'm guessing that they must be impact craters. But I can't find them on any lists of Finnish impact craters. Also, it seems highly unlikely for there to be two similarly-sized craters so close together (unless a single meteor broke into two before impact, or they are of very different ages and the local geography happens to be very good at preserving impact craters of this sort of size).


This isn't an April fool joke - see for yourself.

Zooming in

Friday, September 12th, 2003

I finally got the 30m resolution Landsat data working with BlueMarbleViewer! It looks fantastic, although the colour saturation is still a bit low. So far I have processed the data for the South-West of England, Seattle and New York City (although I haven't seen the NYC data in action yet since it hadn't finished processing when I left for work). I wonder which area I should do next...

The antibiotics are making me a bit nauseous but fortunately it's a fairly slow week at work so I can take it easy.

Marbles and toenails

Monday, September 8th, 2003

I found a fiddly bug in BlueMarbleViewer and gained admiration from the other guys who are hacking the thing. Meanwhile, work on the utility to import the Landsat data is coming along slowly but surely.

Satellite photography

Friday, September 5th, 2003

The University of Maryland's Global Land Cover Facility Earth Science Data Interface provides the means to download Landsat 7 data (30m resolution) from almost any land location on the planet. The data is in a rather fiddly form (separate 60Mb non-normalized GeoTIFF files for each channel) so I really need to write a little program to put them into a format I can use with BlueMarbleViewer.

My blog has been somewhat geeky lately, so here are some pictures of cute kittens.

Awesome!

Thursday, September 4th, 2003

Wow, I got the high resolution (~30m) Hawaii data to work with BlueMarbleViewer! It looks incredible - you can see the runways at the airport and everything.

Now to go and do my real job.

Playing with planet Earth

Wednesday, September 3rd, 2003

I've been playing around with this neat little piece of software, Blue Marble Viewer. Basically this displays a picture of Planet Earth from any angle you care to choose - like a sort of virtual globe. You can zoom in and see all sorts of details of the surface, from ripples of sand in the desert to pollution in lakes to deforestation in the Amazon rainforest to impact craters to the Great Wall of China and everything in-between. It uses an obscene amount of disk space (about 2Gb uncompressed) and the resolution of the most detailed picture works out at 40960x20480 pixels, which means that each pixel is a little over 1km square at the equator (less at the poles). The overall effect is quite incredible.

The data comes from the Blue Marble section of NASA's Earth Observatory website (which is one of the most awesome sites on the web in my opinion). Another image on that site is a composite of global cloud patterns, which I liked so much I printed it out, framed it and hung it on my kitchen wall. Yet another is the famous "Earth at night" picture which is the desktop wallpaper of one of my computers at work.

I've got BMV compiling and (more or less) running under Windows now, but there are still a number of bugs.

Very geeky fun.