Archive for the ‘maths’ Category

The story of the sprite, the string and the castle

Tuesday, July 29th, 2008

Many years ago I wrote a ASCII/ANSI/text-mode design program called SCRDES (for screen designer). It was probably the most sophisticated thing I had ever written at the time - it had many features (circles, lines, rectangles etc.) and little text mode windows that would pop up over your drawing to do things like select different tools and colours and save or load your drawing. I mostly used it for designing levels for my game "Cool Dude".

A bug in this program spawned an interesting little puzzle. The bug appeared right after I had added the user friendly interface with the text mode windows. These worked by saving the part of the screen behind the window and restoring it to make the window disappear again. However, the first time I tried to remove a window that was on top of a picture, I got some strange garbage instead of the picture I wanted. For example, the image:
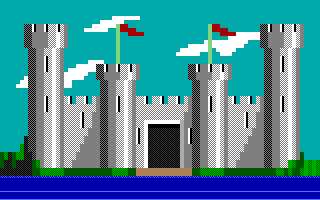
would be turned into this:
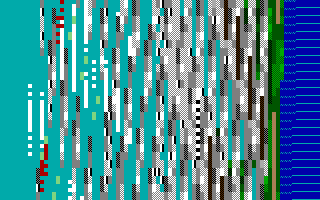
Each time I created and destroyed the window, the garbage changed. I quickly realized that the bug was that I was saving the image into a string one way (scanning horizontally left to right and then top to bottom) and restoring it another way (scanning vertically top to bottom and then left to right). So I was putting back the same data, just in the wrong order.

The patterns in the garbage were interesting, so I wrote another program, called SPRITE (small bitmaps are often called sprites) which took an image and transformed it in this way repeatedly and which could be made to go forwards or backwards. I quickly discovered the following things:

  • After a certain number of iterations in one direction, the picture becomes the same as the original. This number depends on the dimensions of the picture. A square picture, for example 8x8 or 25x25, would be restored to the original after only 2 iterations but anything more complicated takes many more. The 80x25 castle image above takes 999 iterations to return to the original.
  • Some of the intermediate images consisted of smaller copies of the original arranged in a rectangular grid:
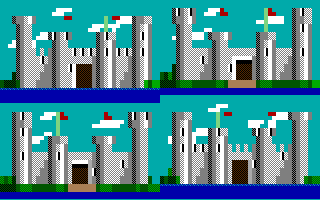
    Sometimes these smaller images would be upside-down, sideways, or even diagonal (straddling the edges in a toroidal fashion):
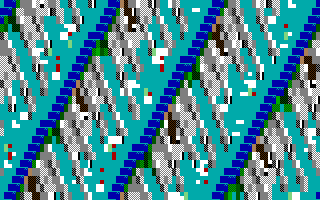
  • Sometimes, instead of being shrunk, the image appears to be enlarged and interleaved with the other parts of itself:
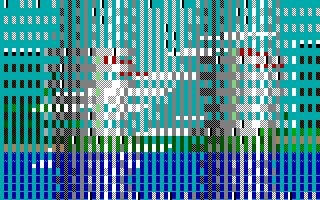
After thinking about this for a while one can sort of see why it happens. Consider what happens to the point (1,0). After some number of iterations it will end up at the point (x,y) and the point (2,0) will end up at (2x,2y). The transformation is linear in some sense (modulo the edges) so you get affine transformations of the original image.

To figure out how many iterations it will take to return an x*y image back to its original self, I think one can just consider the trajectory of the point which starts off at (1,0) under the repeated applications of the transformation (a,b)->(⌊(bx+a)/y⌋,(bx+a) mod y) or, equivalently, the point 1 under the transformation c->(c mod y)*x+⌊c/y⌋ - once that ends up back where it started the rest will fall into place by linearity. I think the answer is the multiplicative order of x modulo xy-1, based on some tinkering with the OEIS, but I'm not sure how to go about proving it.

The trajectory can contain every point in the grid (except the top left and bottom right, which remain fixed) but does not necessarily do so. Some grids (for example 78x66) do but some only contain a fraction (<0.5) of the points. Of the 1998 remaining points in the 80x25 grid, for example, half of them are in the trajectory, the white ones in this image:
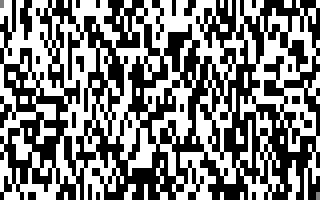
As you can see, this image is symmetrical under the transformation of rotating by 180° and switching black with white.

The following image was made by looking at all the of the possible grids from 2x2 to 65x65 inclusive, calculating the number of iterations required in each case, dividing by the number of points in the grid minus 2 and converting the resulting fraction into a shade of grey (white=1, black=0). So the white points correspond to grids that take the maximum number of iterations (xy-2), the next most common shade (mid-grey) corresponds to grids that take (xy-2)/2 iterations and so on.

I ran the program for grids up to 2001x2002 but the resulting image looks pretty homogeneous. White pixels seem to appear more often on lines corresponding to (some) prime numbers, but don't seem to get as rare as quickly as prime numbers do. Rational numbers <0.5 with small denominators seem to be show up more often.

Another open question is, given a x*y grid and a number of transformations n, how many castles will there be in the resulting image and what angles will they be at? (Or, dually, what fraction of a castle is magnified up to the entire sprite?).

Edit 14th July 2013:

This seems to be closely related (although not quite identical) to Arnold's cat map.
Pot or not-pot

Monday, July 28th, 2008

This post is based on a maths lesson I had as a very young child. It was in my first primary school so I couldn't have been more than 9. I had some fantastic maths lessons at that school - one fun one that I remember was my first introduction to the Fibonacci series by a population of breeding rabbits. Another involved colouring squares of the multiplication table according to whether each number could be divided by some other number and seeing what patterns emerged.

The idea behind this lesson was this. You have a (bizarre) snooker table which is a rectangle whose width and length are integers, and whose only pockets are in the corners. You start with the ball in one corner and hit it at a 45 degree angle from one of the sides, very hard. It bounces off the various edges some number of times and eventually ends up in one of the other 3 corner pockets (it can't end up in the pocket where it started because it would have had to retrace its steps, which must have meant that it bounced off some edge perpendicular to its path, but its paths are always at 45 degree angles to the only edges).

If it ends up in the pocket opposite where it started, that is a "pot" and if it ends up in one of the other two corners, that is a "not pot". Can you find the rule for determining whether an x by y table results in a "pot" or a "not pot"? What fraction of tables result in a "pot"? As I recall we spent a happy time drawing rectangles and tracing out the patterns made by the ball. We noticed that square tables (plus tables whose width was odd multiple of their length) were always "pot"s and tables whose width was an even multiple of their length were "not pot"s. I think we noticed that given any integer n, an x by y table had the same result as an nx by ny table. We may even have statistically determined that about 1/3 of the tables were "pot"s, but as I recall we didn't find the general pattern.

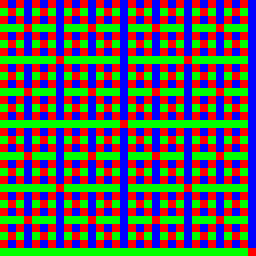
Today (at least 20 years later!) I finally got around to doing some more investigation on this. I wrote a program to perform the algorithm for different sized tables and plotted the results on a graph (red is "pot" and the green and blue are the other two corners):

There is an interesting fractal structure here. If you have the picture for tables up to size 2n by 2n you can get the picture for tables up to 2n+1 by 2n+1 by repeating the 2n by 2n picture 4 times and then fixing up the 2n by 2n+1 and 2n+1 by 2n tables. From the recurrence relation thus found one can prove that given a random table, the three pockets are equally likely.

The patterns here make me suspect that there might be some simple algorithm for finding the pocket based on the binary expansions of the table dimensions. I'm not sure what it is though.

One simple (non-binary) method for finding the pocket given the table dimensions is described here.

Why carbon credits are not like Catholic indulgences

Friday, July 18th, 2008

A few times now I've heard the meme comparing carbon offset credits to Catholic indulgences - where one can "buy one's way out of punishment". I think this argument is completely bogus and that the similarities are superficial at best.

Carbon offsetting is an economic solution to an economic problem. Many people want to live a more green life but don't want to change their habits to do so - many of the things that they want to buy or do (like air travel) don't have (more expensive) carbon-neutral equivalents. Perhaps such equivalents are possible but the demand isn't sufficient yet for them to be practical. But just like the invention of money made trades possible that were impractical with the barter system, carbon credits make it possible for some people to be carbon neutral without everybody having to be so at once.

The key here is that the aim of the exercise is to reduce the total amount of carbon dioxide in the atmosphere. Doing something which adds CO2 and something else which removes it is just as good as doing neither.

Sin, forgiveness and punishment don't work like that, though - doing one good deed doesn't (and shouldn't) make up for an unrelated sin of equivalent value, because (unlike CO2) the total amount of sin isn't a meaningful concept - everyone just cares about the sins that are made against them in particular.

Also, Carbon credits can have a measurable effect whereas it's impossible to be sure just how long you're going to spend in purgatory. So fraud is more difficult (though still possible - we do need to have some way of ensuring that the money spent on Carbon credits is actually being spent on what it is being purported to instead of being squandered and that that activity is having the desired effect).

Overlapping images in escape time fractals

Tuesday, July 15th, 2008

This is a post I made on sci.fractals recently (it didn't get any replies there though).

I've been playing about with drawing escape time fractals using different formulae. I've noticed that some formulae give images which seem to have a strange feature - in some places it looks like there are two overlapping images, with one image showing through in areas of the other.

For example, here is an image I made using the formula
z <- (z+1)*(z+c)*(z+i)

Can anybody help me to understand what is going here? Are there really two iterative process going on hidden in one formula or is it an illusion? Does this phenomenon have a name that I could search for to find out more about it?

Magic inflation-linked currency

Monday, June 16th, 2008

Imagine if one measured the amount of money one had as a fraction of the total amount of money in the world rather than in arbitrary units. That way, when inflation happens, the number representing the amount of money you have goes down rather than prices going up.

Obviously that would be rather difficult to do with old-fashioned coins and notes but it would be trivial for a Cryptonomicon-style completely electronic currency. We'd probably use units of trillionths or thereabouts (or maybe "year 2000 dollars") to avoid having to write too many zeroes (and avoid accidents miscounting them).

One advantage of such a way of measuring money would be that the effects of inflation would be rather more obvious to people (at least, those of us who keep a more careful eye on our bank accounts than we do on the consumer price indexes) and might therefore discourage inflation somewhat. It would feel more like a tax (which, of course, is what it really is when it comes down to it - a very fair tax, I think, since the people with large reserves of cash seem to be the people who can best afford to pay taxes).

Another advantage is that it becomes easier to compare prices over time (since you don't have to adjust for inflation). A third is that things that tend not to be index linked (but which really should be, like salaries) would be more likely to.

A side effect would be that the velocity of money would greatly increase - cash would be a hot potato.

Use derivatives for SOI

Sunday, June 15th, 2008

This is an elaboration on a point from an earlier blog post.

Synchronous orbit iteration is a way of speeding up the calculation of fractals. The idea comes from the observation that the orbits of nearby points follow similar trajectories for a while. So one can take a rectangular array of points and subdivide them once a rectangular array no longer approximates them
well.

It seems to me that a better way to do this might be to compute some the derivatives of the iteration function and iterate them instead of a grid of points, for the same reason that the accuracy of numerical integration is usually better improved by switching to a higher-order method than by decreasing the step size.

This method simplifies the algorithm which determines whether to subdivide or not (just see if the magnitude of the highest derivative exceeds some limit, rather than looking for rectangularity - which amounts to the same thing for the second derivative).

It's also even easier to subdivide - instead of interpolating to find the intermediate iteration points, just evaluate the Taylor series.

Of course, I'll need to do some experiments to determine if this is truly a better method (at the moment there are some more fundamental changes that my fractal plotter needs before I can play with this sort of thing). As far as I can tell nobody's ever tried it before, though. Classical SOI is difficult enough to get right.

Complex analysis and Clifford algebra

Friday, June 6th, 2008

Complex analysis is a very beautiful and useful mathematical theory. Clifford (geometric) algebra is also very beautiful and useful. So it makes sense to wonder if they can be combined. Turns out that they can. I wonder why I haven't seen more stuff about this in the wild? Probably because it's pretty new as mathematics goes. I expect it will be part of every undergradaute mathematics degree in 50 years or so. But I suppose it depends if it turns out to be as useful as it seems, by rights, it ought to be.

Rotating fractals

Thursday, May 22nd, 2008

Fractals like z=z^2+c and z=z^3+c are easy to draw because they just involve complex addition and multiplication. What happens if we try to generalize these sorts of fractals to non-integer powers?

We can do this using the identities
\displaystyle z^w = (e^{\frac{\log z}{\log e}})^w = e^{w\frac{\log z}{\log e}}
\displaystyle e^{x+iy} = e^x(\cos y + i \sin y)
\displaystyle \frac{\log z}{\log e} = \frac{\log |z|}{\log e + i(\arg z + 2n\pi)}

The trouble is, we have to pick a value for n. Given a parameter \theta we can pick n such that \theta - \pi \leq \arg(x+iy) + 2n\pi < \theta + \pi (i.e. choose a branch cut of constant argument and a sheet of the Riemann surface): \displaystyle n = \lfloor\frac{1}{2}(\frac{\theta - \arg(x+iy)}{\pi} + 1)\rfloor. Then as we gradually vary \theta the fractal we get will change. For w = u+iv, v \ne 0, increasing \theta will cause z^w to "spiral in" from infinity towards the origin (v<0) or out (v>0). When v = 0, increasing \theta will have a periodic effect, which will cause the fractal to appear to "rotate" in fractally sort of ways with a period of \displaystyle \frac{2\pi}{u}.

It would be interesting to plot these as 3D images (like these with \theta on the z axis. These would look sort of helical (or conical, for v \ne 0.)

Using u < 0 poses some additional problems - the attractor isn't bound by any circle of finite radius about the origin so it's more difficult to tell when a point escapes and when it is convergent but just currently very far out. Clearly some further thought is necessary to plot such fractals accurately - perhaps there are other escape conditions which would work for these.

Economics

Sunday, May 18th, 2008

I used to think economics was a terribly dry subject, but lately (especially since I've become part of the working population and a homeowner) I have been finding it interesting to think about how wealth, money and value are created, destroyed and moved around.

For example, would we all be better off if we tried to create wealth that lasts at the expense of ephemeral wealth? Perhaps to some extent, but on the other hand one can have too many marble statues and too few cheese sandwiches.

Where the money goes

Saturday, May 17th, 2008

There was an interesting piece on the radio a while ago about some people who had a religious objection to war - specifically, their religion said that they could not pay taxes if that money would go to funding a war.

That got me wondering - what would be the consequences of trying to accommodate these people? Suppose that your tax forms had a series of boxes which you could check to tell the government what you want your tax money to go towards. Then the government could try to ensure that the war was funded only by the tax money from people who had ticked the "war" box on the tax form, and fund everything else with what is left over.

Of course, the government couldn't guarantee that peoples' money went where they wanted it to go (if they could, many people would probably just leave all the boxes unticked, or just tick the cheapest boxes in an attempt to pay no tax or less tax.

But even as a non-binding thing, the aggregate data could be useful as a gauge of public opinion - if the war is costing much more money than the taxes paid by the people who actually think it's a good idea, maybe it's time to elect a government that will end the war. Similarly for roads, schools, healthcare and welfare. Such a thing might encourage governments to be more open about what your money is being spent on and why.