This post is based on a maths lesson I had as a very young child. It was in my first primary school so I couldn't have been more than 9. I had some fantastic maths lessons at that school - one fun one that I remember was my first introduction to the Fibonacci series by a population of breeding rabbits. Another involved colouring squares of the multiplication table according to whether each number could be divided by some other number and seeing what patterns emerged.
The idea behind this lesson was this. You have a (bizarre) snooker table which is a rectangle whose width and length are integers, and whose only pockets are in the corners. You start with the ball in one corner and hit it at a 45 degree angle from one of the sides, very hard. It bounces off the various edges some number of times and eventually ends up in one of the other 3 corner pockets (it can't end up in the pocket where it started because it would have had to retrace its steps, which must have meant that it bounced off some edge perpendicular to its path, but its paths are always at 45 degree angles to the only edges).
If it ends up in the pocket opposite where it started, that is a "pot" and if it ends up in one of the other two corners, that is a "not pot". Can you find the rule for determining whether an x by y table results in a "pot" or a "not pot"? What fraction of tables result in a "pot"? As I recall we spent a happy time drawing rectangles and tracing out the patterns made by the ball. We noticed that square tables (plus tables whose width was odd multiple of their length) were always "pot"s and tables whose width was an even multiple of their length were "not pot"s. I think we noticed that given any integer n, an x by y table had the same result as an nx by ny table. We may even have statistically determined that about 1/3 of the tables were "pot"s, but as I recall we didn't find the general pattern.
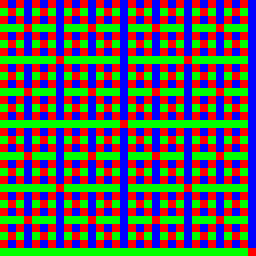
Today (at least 20 years later!) I finally got around to doing some more investigation on this. I wrote a program to perform the algorithm for different sized tables and plotted the results on a graph (red is "pot" and the green and blue are the other two corners):

There is an interesting fractal structure here. If you have the picture for tables up to size 2n by 2n you can get the picture for tables up to 2n+1 by 2n+1 by repeating the 2n by 2n picture 4 times and then fixing up the 2n by 2n+1 and 2n+1 by 2n tables. From the recurrence relation thus found one can prove that given a random table, the three pockets are equally likely.
The patterns here make me suspect that there might be some simple algorithm for finding the pocket based on the binary expansions of the table dimensions. I'm not sure what it is though.
One simple (non-binary) method for finding the pocket given the table dimensions is described here.