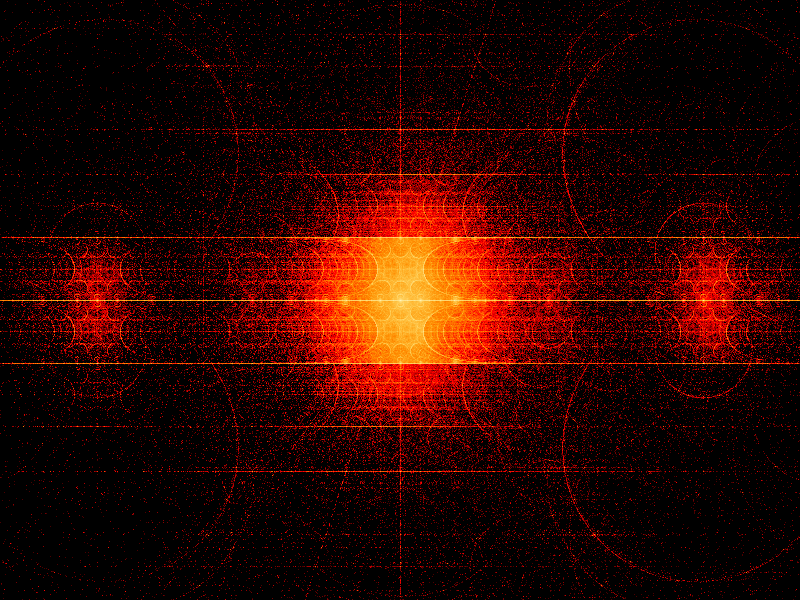
A commenter on Tuesday's post wondered what the density function of numbers with low complexity looks like. This seemed like an interesting question to me too, so I wrote some code to find out. This is the result:

I actually used a slight modification of the complexity metric (L(exp(x)) == L(-x) == L(log(x)) == L(x)+1, L(x+y) == L(x)+L(y)+1, L(0) == 1) and a postfix notation instead of a bracketing one. These are all the numbers x with L(x)<=20. More than that and my program takes up too much memory without some serious optimization.
The smooth curves and straight lines are functions of the real line (which is quite densely covered). The strong horizontal lines above and below the center (0) lines are +πi and -πi, which occur from taking the logarithm of a negative real number. There is a definite fractal nature to the image and lots of repetition (as one would expect, since every function is applied to every previously generated point up to the complexity limit).
I didn't add duplicate elimination rules for duplicates that didn't appear until L(x)>=8 or so, so some points are hotter than they should be, but I don't think fixing this would make the image look significantly different.
The code is here. This header file is also required for the Complex class, and this in turn requires this and this. The program is actually a sort of embryonic symbolic algebra program as it builds trees of expressions and pattern matches strings against them. It generates a 1280x1280 RGB image which I cropped down to 800x600. The colour palette is based on a thermal spectrum where temperature goes as an inverse seventh root of the number of hits on a pixel (no particular mathematical reason for that - I just think it makes it look nice). The points between black and red are fudged a bit.
Hi,
Very nice image sir!
You should take some of your images to Bridges conference. Next summer it will be in Banff. It is a great conference you would enjoy it.
Cheers,
Kaz